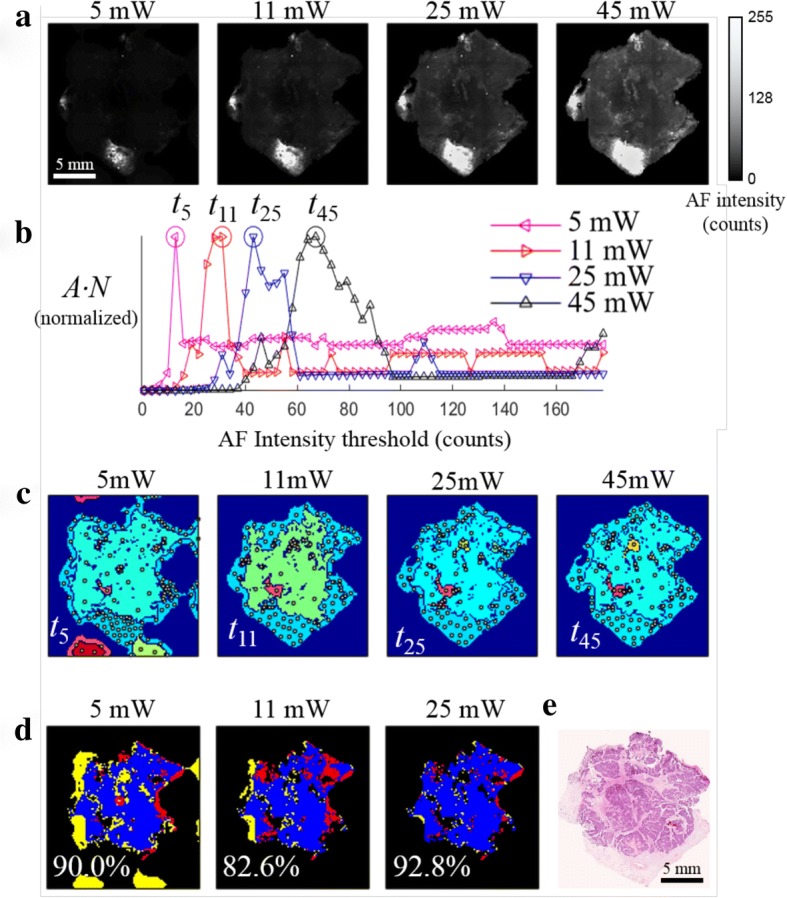
Fig. 2.

Method for unsupervised segmentation of auto-fluorescence (AF) images of breast tissue. a AF intensity images of a typical breast tissue sample containing invasive carcinoma obtained at difference excitation laser powers. b Representation of the total area captured by all segments to total number of segments for each image (A·N) versus the segmentation threshold. c Segmented AF images using the optimized intensity thresholds t5, t11, t25, t45; white dots indicate the sampling points for Raman spectroscopy. Each segment is assigned a unique, arbitrary color in these images. d The computed overlap with segmentation of the 45-mW image; blue, regions captured in segments in both AF images; red, regions were in segments in the 45-mW image but not in the images at lower power; yellow, regions in segments of AF image at lower laser power but not the 45-mW image. e Hematoxylin and eosin (H&E) section. The dense clusters of dark blue dots are tumor cells
