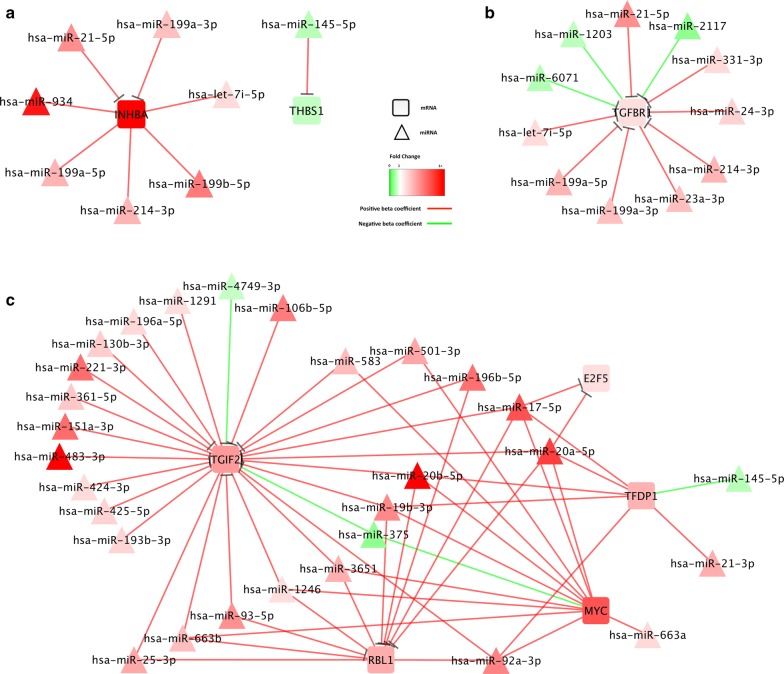
Fig. 2.
MiRNA-mRNA associations involving genes in the KEGG TGFβ-Signaling Pathway by location of action: extracellular factors (a), membrane receptors (b), and nuclear factors (c). mRNAs are shown as squares and miRNAs are shown in triangles. miRNA-mRNA associations are shown with lines (—) between the miRNA and mRNA pair, with an identified seed match are shown with a (—|) on the mRNA end of the line. Interactions with positive beta coefficients are shown with red lines, and those with negative beta coefficients are shown with green lines. Similarly, upregulated molecules are shown in red, with brighter red indicating a higher FC, and downregulated molecules are shown in green, with brighter green indicating a FC closer to 0

