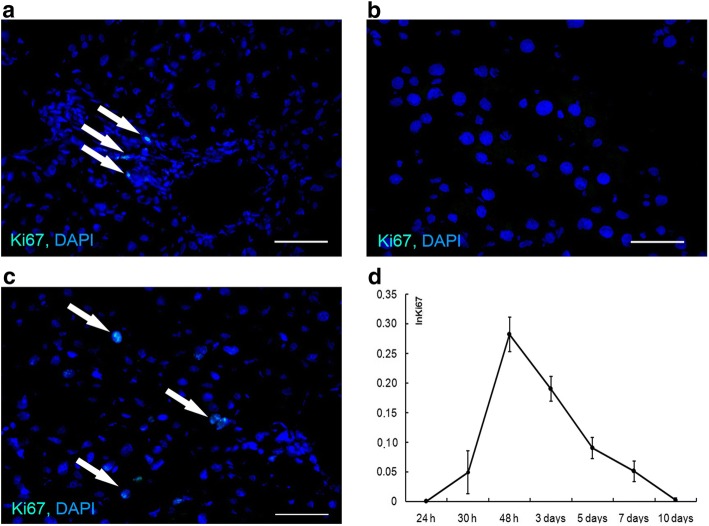
Fig. 1.
Hepatocyte proliferation dynamics. Ki67 expression in the intact liver (a) and in the residual livers at 24 h (b) and at 30 h (c) after the surgery. Index of Ki67+ hepatocytes is plotted against time after the surgery (d). The data are represented as mean values ± SD. Bars, 50 μm; cell nuclei are counterstained DAPI (blue). Arrowheads indicate Ki67+ cells (a, b, c)

