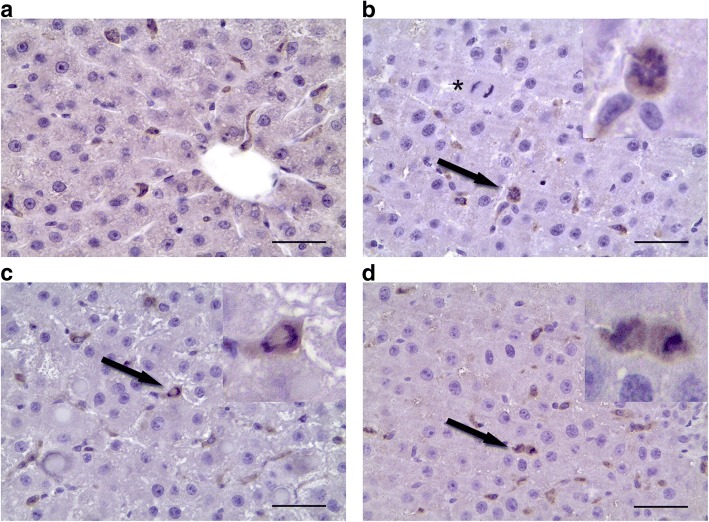
Fig. 4.
Macrophage proliferation dynamics. CD68+ macrophages (brown) in the intact liver (a) and in the residual liver at 48 h after the surgery. Arrowheads indicate metaphase (b), anaphase (c) and telophase (d). Bars, 50 μm; cell nuclei are counterstained with hematoxylin (blue). The asterisk indicates a dividing hepatocyte

