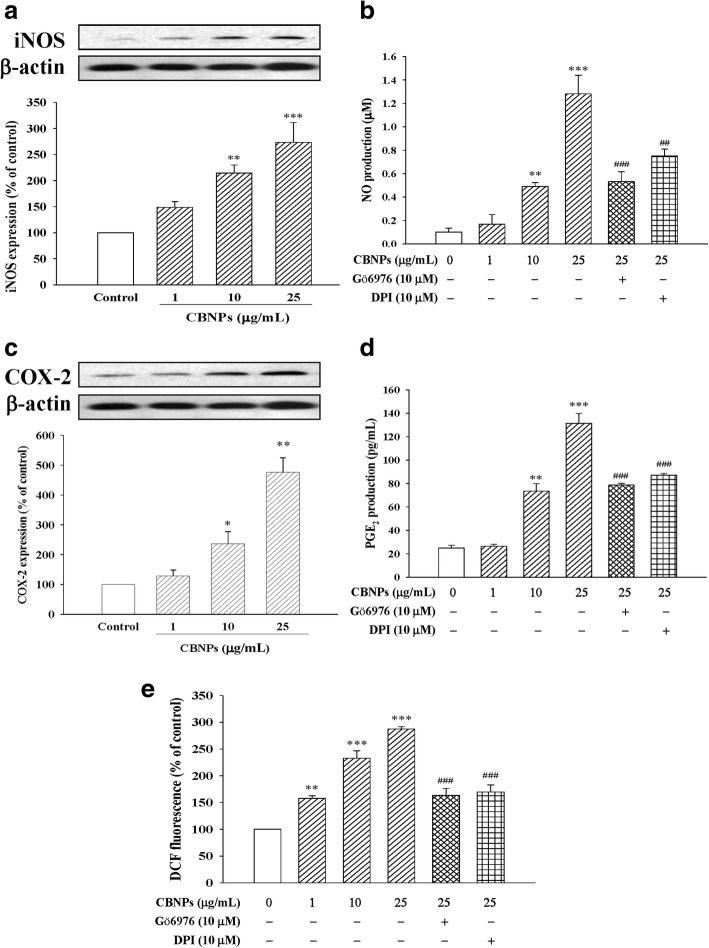
Fig. 3.
Effects of CBNPs on iNOS expression (a), effects of Gö6976 or DPI on NO production (b), COX-2 expression (c), and effects of Gö6976 or DPI on PGE2 production (d), and effects of Gö6976 or DPI on ROS production (e) in A549 cells. Cells were treated with CBNPs (1, 10, 25 μg/mL) for 24 h or pretreated with Gö6976 or DPI for 1 h respectively, and then treated with CBNPs (1–25 μg/mL) for 24 h. ROS production was measured using H2DCF-DA staining and detected the DCF fluorescence by flow cytometer. Bars represent the mean ± S.E.M. from six independent experiments. *P < 0.05, **P < 0.01, ***P < 0.001 vs. control group (without any treatment). ##P < 0.01, ###P < 0.001 vs. CBNPs (25 μg/mL) group

