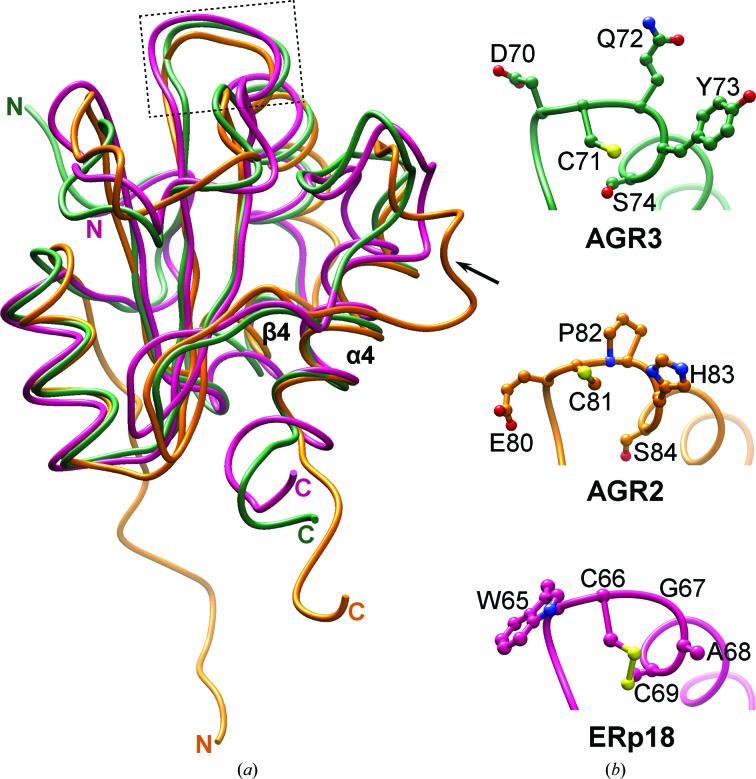
Figure 2.
Comparison of AGR3 with AGR2 and ERp18. (a) Superposition of the crystal structure of AGR3 (green; PDB entry 3ph9) with the NMR solution structure of AGR2 (orange; PDB entry 2lns) and the crystal structure of ERp18 (pink, PDB entry 1sen) shows no large differences except for the loop connecting β4 and α4 (marked by an arrow), which is longer in AGR2, and the position of the N-terminal extension prior to α1, which has a different orientation in AGR2. Coordinates were superimposed using UCSF Chimera. The localization of the active-site motif in the structures is shown by the box. (b) Close-up view of the active-site motif DCYQS in AGR3 (green), ECPHS in AGR2 (orange) and WCGAC in ERp18 (pink). Amino-acid side chains are shown in ball-and-stick representation with N atoms in blue, O atoms in red and S atoms in yellow.

