Figure 3.

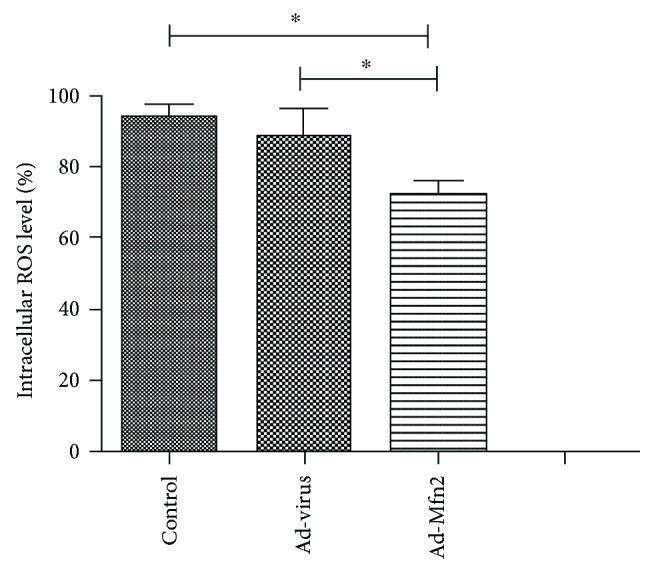
ROS levels were tested using flow cytometry by the DCFH-DA fluorescent probe. There were significant differences between the Mfn2 overexpression group and the control group for ROS level of pancreatic cancer (∗ P < 0.05; N = 3).

ROS levels were tested using flow cytometry by the DCFH-DA fluorescent probe. There were significant differences between the Mfn2 overexpression group and the control group for ROS level of pancreatic cancer (∗ P < 0.05; N = 3).