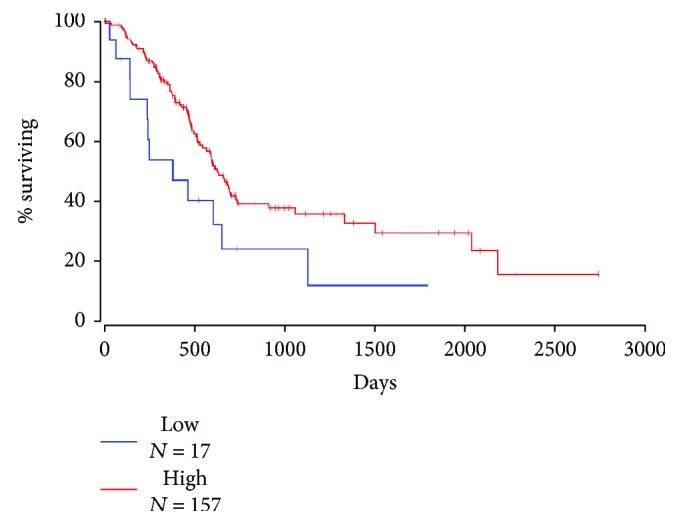
Figure 7.

Overall survival curves of patients with pancreatic cancer. The Mfn2 expression curve was calculated according to the Kaplan-Meier method. The red line is the higher expression group (n = 157), and the blue line is the lower expression or without group (n = 17).
