
Figure 2.
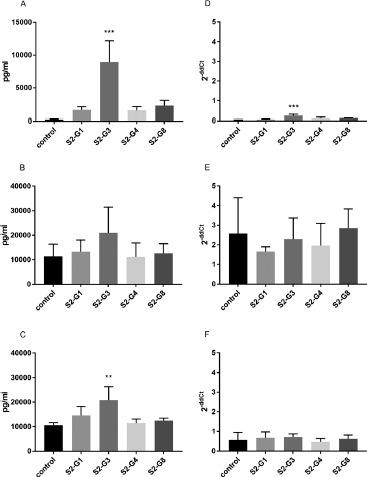
Quantification of IL-8 secretion (A–C) and mRNA expression (D–F) by HT-29 cells incubated with the supernatants of different E. coli strains. IL-8 secretion and expression of unstimulated cells (A and D), cells stimulated with TNF-α (B and E), and cells stimulated with IL-1β (C and F) are shown. **p < 0.01 and ***p < 0.001 show statistical significance in comparison with the control. Data are given as means and standard deviation (n = 3)