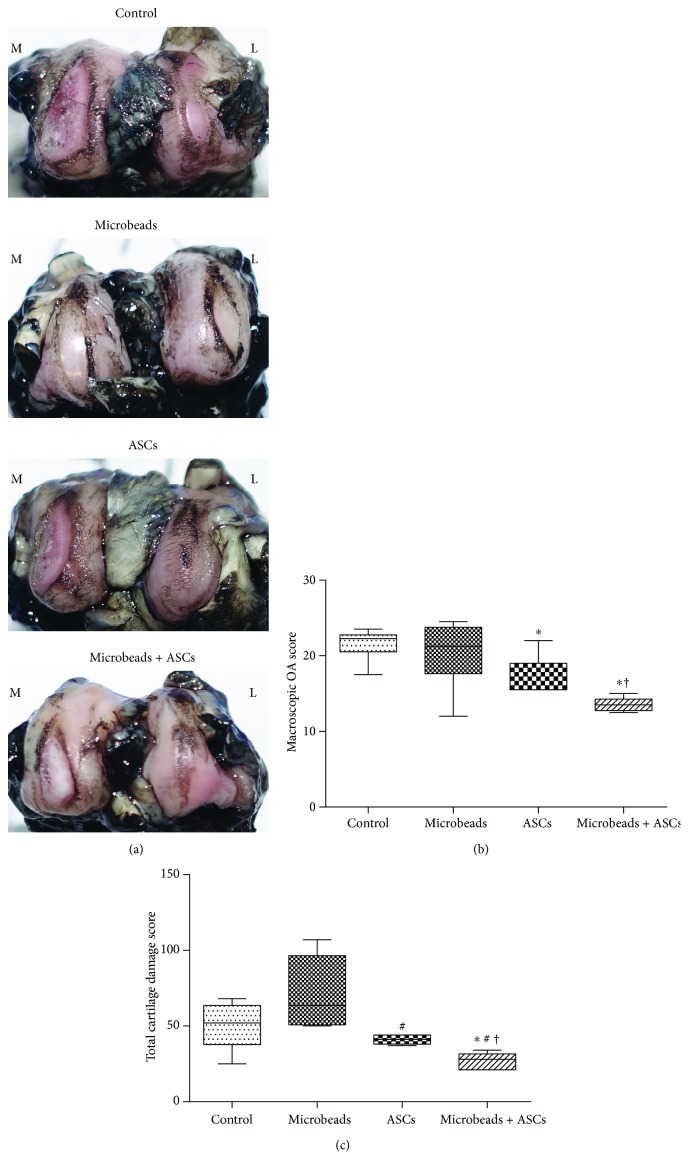
Figure 2.
Macroscopic analysis of femoral condyles at 9 weeks after ACLT. (a) A representative specimen of a condyle (from each group) stained with India ink to identify any fibrillation and erosion. (b) The macroscopic OA score. (c) The TCDS. ∗A significant difference from the control group (P < 0.05). #A significant difference from the alginate microbead group (P < 0.05). †A significant difference from the ASC group (P < 0.05).

