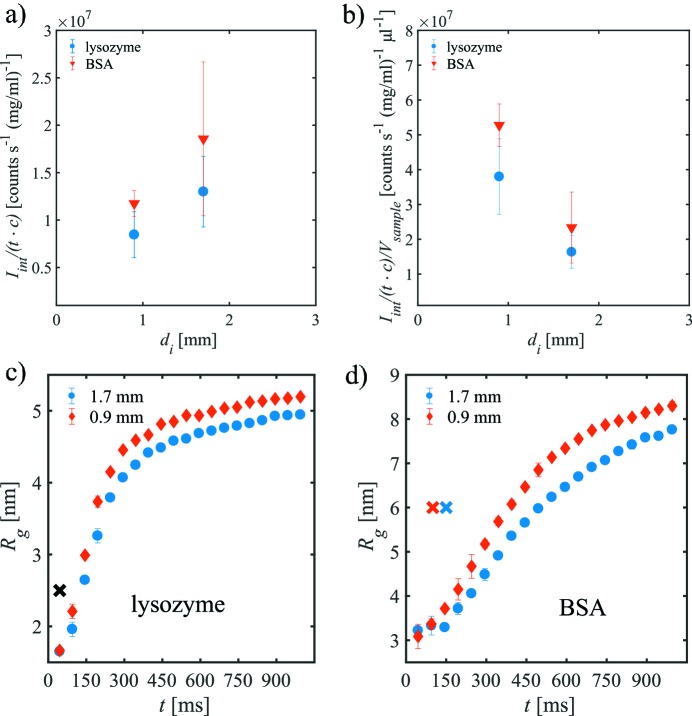
Figure 2.
(a) Integrated scattering intensity per time t and per 1 mg ml−1 of lysozyme and BSA concentration c in both capillaries. The data were corrected for absorption by the walls of the quartz capillaries. (b) Intensity per time and per sample volume, V sample, needed to fill the capillary, that is much larger than the focal volume of the beam (see Table 1 ▸). Radii of gyration of the fixed protein solution as a function of exposure time for (c) lysozyme and (d) BSA. The crosses mark the number of single SAXS curves accepted by CorMap (blue: d i = 1.7 mm; red: d i = 0.9 mm; black: for both).

