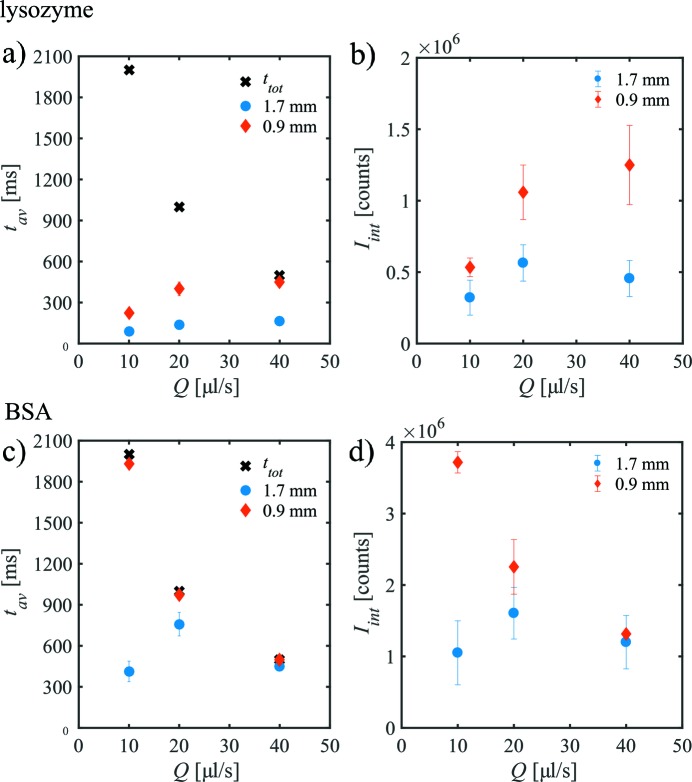
Figure 5.
The exposure time before showing radiation damage, t av, and the integrated scattering intensity I int, as a function of volume flow rate Q for lysozyme (a, b) and BSA (c, d) solutions in both capillaries. The total exposure time t tot of each measurements is also shown. (Data and error bars are derived from repeated measurements.)

