Figure 6.
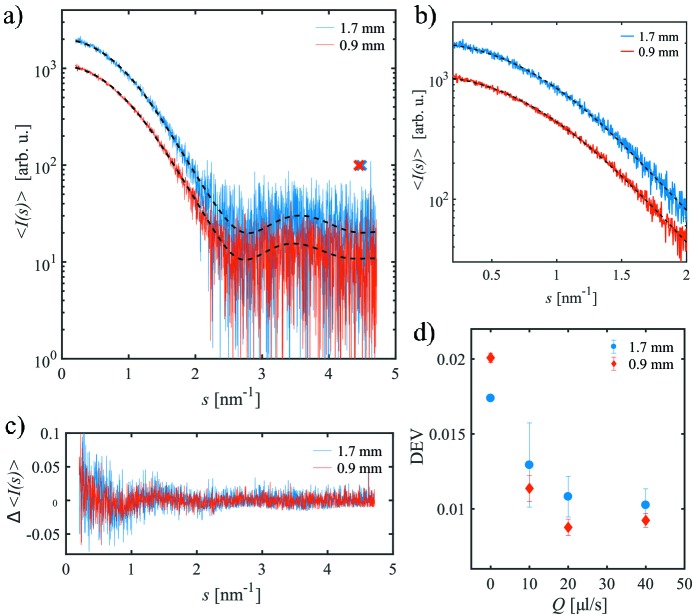
(a) Frame-averaged SAXS curves 〈I(s)〉 for the lysozyme sample in the d i = 1.7 mm and d i = 0.9 mm capillaries at a total volume flow rate Q = 20 µl s−1. Dashed lines are the corresponding smooth AUTOGNOM curves. The maximum useful data ranges s opt are marked by crosses. (b) Zoom of (a) at smaller s. The noise level for the smaller capillary is improved compared with the larger one. (c) Normalized deviation from the AUTOGNOM curve, Δ〈I(s)〉, for both curves. (d) Parameter DEV as a function of the total volume flow rate Q for both capillaries.

