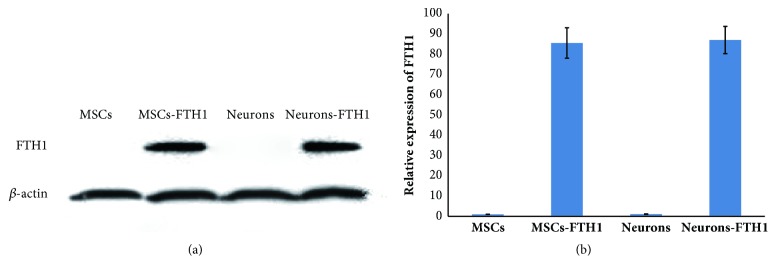
Figure 6.
FTH1 expression in cells before and after differentiation. (a) Western blot results revealed that MSCs and Neurons did not exhibit a target band, whereas MSCs-FTH1 and Neurons-FTH1 both exhibited a significant target band. (b) The gray density analysis results showed that the gray density ratio between MSCs-FTH1 and Neurons-FTH1 did not exhibit significant differences (P>0.05).

