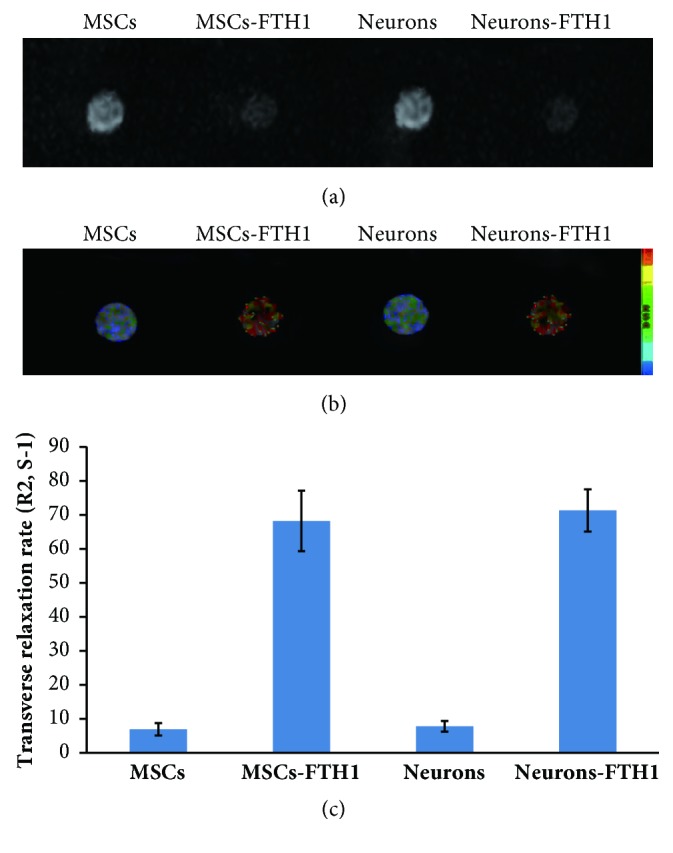
Figure 8.

MR imaging of cells in vitro. (a) T2WI revealed that the signals in MSCs-FTH1 and Neurons-FTH1 significantly decreased compared with MSCs and Neurons. (b)-(c) R2 map and R2 value measurement revealed that R2 values in MSCs-FTH1 and Neurons-FTH1 were significantly increased compared with MSCs and Neurons-FTH1 (P<0.05). However, no significant differences were noted between MSCs-FTH1 and Neurons-FTH1 (P>0.05).
