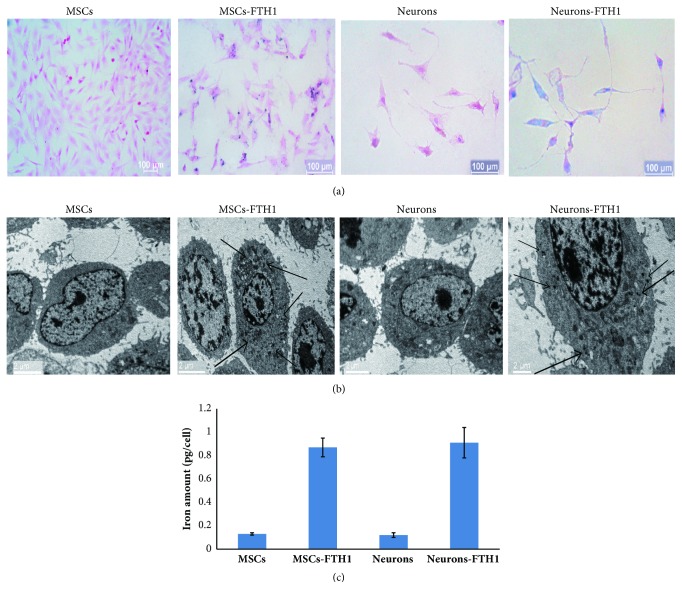
Figure 9.
The iron transport effect of FTH1. (a) Prussian blue staining: there was an increased number of blue particles in the cytoplasm of both MSCs-FTH1 and Neurons-FTH1, whereas no obvious blue particles were observed in MSCs and Neurons in the control group. (b) Transmission electron microscopy: the cytoplasm of MSCs-FTH1 and Neurons-FTH1 contained black electron-dense particles (arrows), whereas the cytoplasm of MSCs and Neurons in the control group did not contain electron-dense particles. (c) Atomic absorption spectrophotometer detection revealed that the iron levels between MSCs-FTH1 and Neurons-FTH1 were not significantly different (P>0.05), but the levels were increased compared with MSCs and Neurons (P<0.05).

