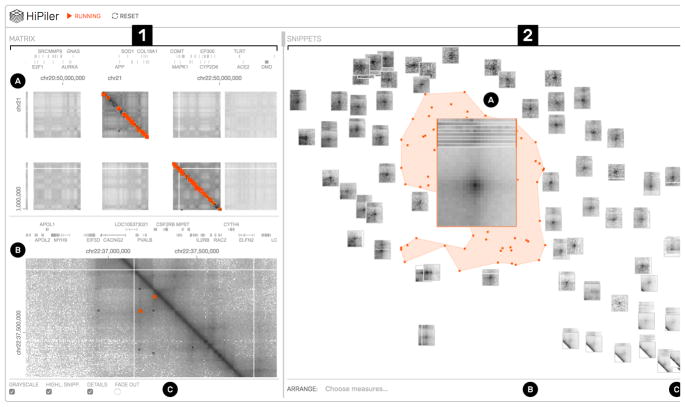
Fig. 1.
HiPiler interface: the matrix view (1) with an overview (1A) and detail (1B) matrix. The snippet view (2) presents regions of the matrix as interactive small multiples. In this example, snippets are arranged with t-SNE (2C) and a well-pronounced pile of snippets is highlighted (2A). View menus for operation are located at the bottom (1C and 2B).

