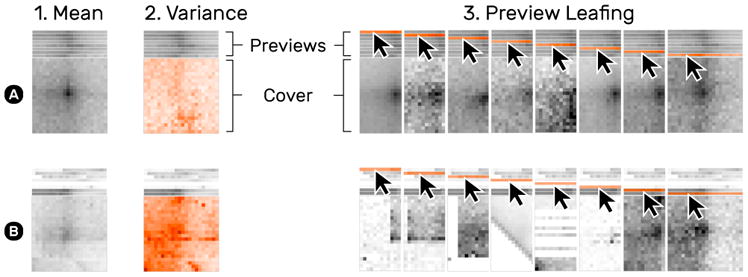
Fig. 12.

Snippet aggregation of a more homogeneous (A) and diverse (B) set of snippets. The default cover shows the mean of snippets on a pile (1). The variance cover mode (2) highlights the deviation of snippets. Moving the mouse cursor over a pile’s previews temporarily shows the corresponding snippet or pile (3).
