
Fig. 14.
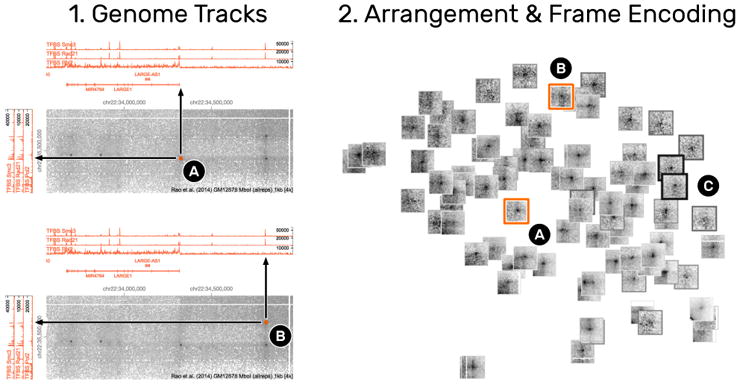
Correlation of snippets with other attributes. (1) The integration of line graphs next to the interaction matrix show genomic measures. 1A and 1B are two snippets (2A and 2B) that exhibit a loop pattern but are correlated with the expression (peaks in the line graph) of different genomic measures, indicating that the underlying ROIs serve different biological functions. Numerical measures can also be integrated into the snippets view (2) by alternating the frame width and color of snippets (2C). Thicker and darker frames indicate higher values.