
Fig. 15.
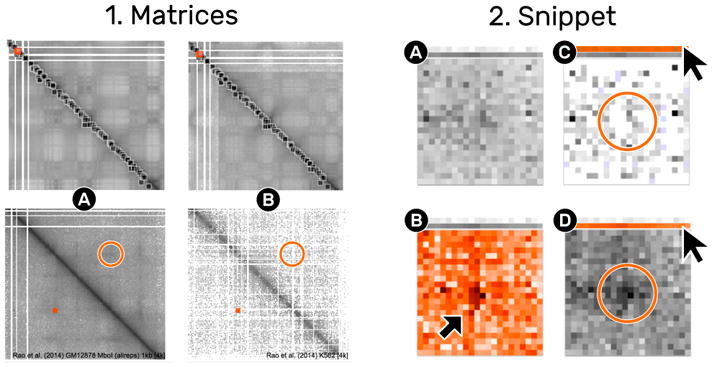
Comparison of one location in two different matrices. The matrix view (1) shows two different matrices (1A and 1B). The ROI indicated by the small square rectangle is extracted from both matrices, displayed as a pile (2A). The mean cover (2A) does not show a pronounced loop pattern in contrast to the variance cover (2B). The detail matrix view indicates that the right matrix (1b) is less dense than the left matrix. Leafing over the previews reveals that the loop pattern is completely gone in (1C) compared to (1D).