
Fig. 3.
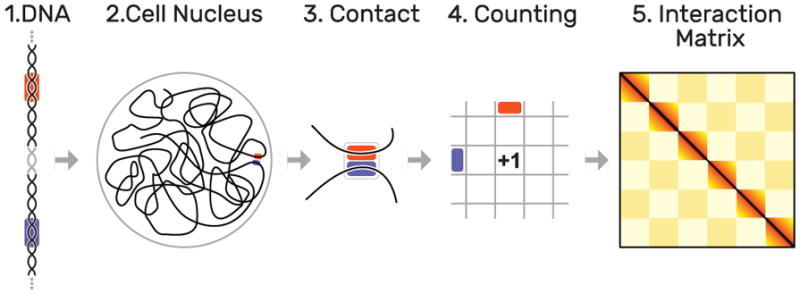
Hi-C methodology: as the DNA (1) is organized non-arbitrarily in the cell nucleus (2), certain parts (highlighted in orange and blue) are frequently in close contact (3). These contacts are quantified over a set of several hundred million cells(4), leading to interaction matrix of up to 3 by 3 million cells (5). Dark colors indicate more frequent contacts occurrences of two loci.