
Fig. 4.
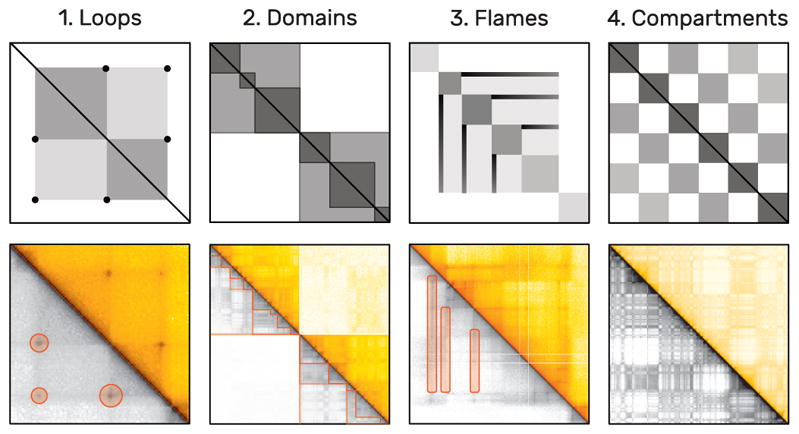
Examples of frequent patterns in interaction matrices by increasing size. The upper plots show schematic illustrations of actual examples below, taken from Rao et al. [37]. As interaction matrices are symmetric, the lower triangular matrix is displayed in grayscale to highlight the patterns using orange markers. Loops (1) appear as dark central dots and span only few cells. Domains (2) are darker rectangles that are presumably organized hierarchically. Flames (3) are horizontal or vertical lines. Active and inactive compartments of the genome create a global checkerboard pattern (4).