
Fig. 8.
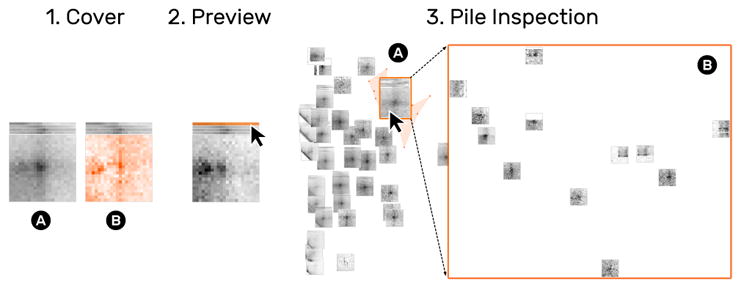
HiPiler displays a cover matrix of the average (1A) or variance (1B) of snippets on a pile. Additionally, each snippet is displayed as a 1D preview showing a horizontal aggregate of the snippet’s rows (2). Moving the mouse cursor over a preview shows the related matrix. Inspecting a pile (3B) temporarily hides all other snippets (3B).