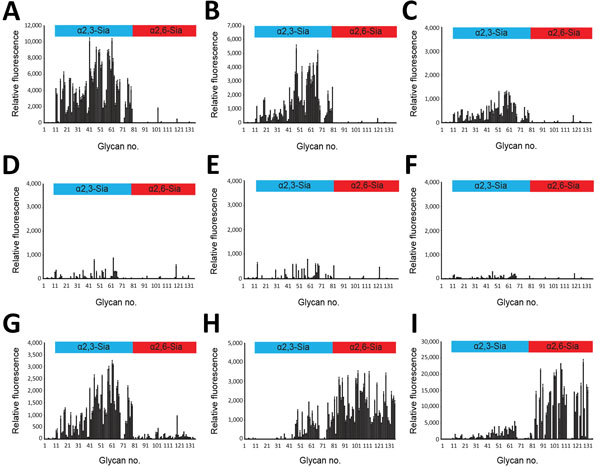
Figure 3.

Glycan microarray analysis of selected influenza A(H5N1) virus isolates from humans, northern Vietnam, 2004–2010. The labeled viruses were applied to a microarray that included α2,3-linked (blue) and α2,6-linked (red) glycans, which are indicated by numbers on the x-axis (Technical Appendix Figure 1). Shown are the binding signals with error bars reflecting SEMs calculated from 4 of 6 replicates on the array after discarding the highest and lowest signals; note that the scales on the y-axis (relative fluorescence) vary because of differences in binding strength: A) CA04/UT3040I/II-HA; B) CA04/UT3040I-HA-138V; C) CA04/UT3040II-HA-186K; D) CA04/UT36250I/II-HA; E) CA04/UT36250I/II-HA-138V; F) CA04/UT36282I/II-HA; G) CA04/UT36282I/II-HA-138V/A; H) CA04/K173; I) Brisbane/10/2007.
