
Figure 1.
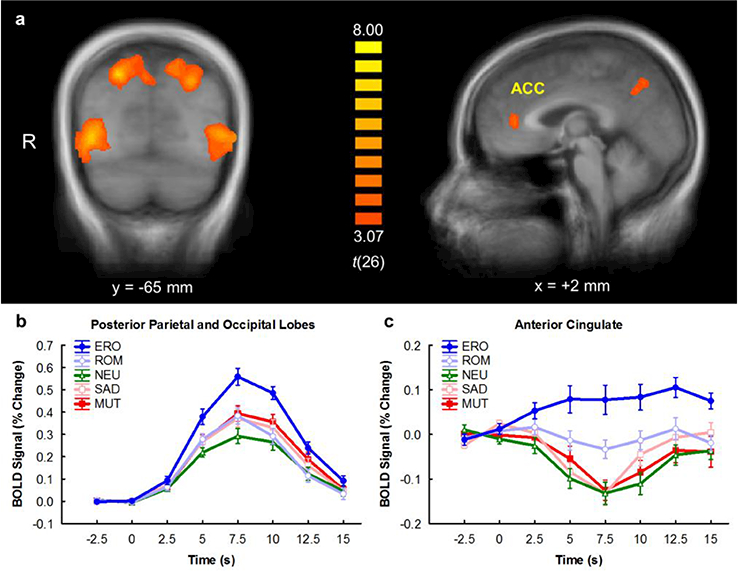
a) Brain areas with significantly larger BOLD responses to emotional stimuli than neutral stimuli. b) Time course of BOLD responses to each picture category in the occipital and posterior parietal lobes. c) Time course of BOLD responses to each picture category in the anterior cingulate cortex. x and y refer to slice locations in Talairach space of the sagittal and coronal slice, respectively. t(26) refers to the t-statistic for the emotional versus neutral contrast. MUT = mutilations, SAD = sad scenes, NEU = neutral, ROM = romance, ERO = erotica. On the time axis, 0 s indicates picture onset. Error bars indicate the mean ± 1 standard error. The time course of activation was expressed as the percent change from the region’s mean level of activation across the entire session. For each trial, the time course was baseline-corrected by subtracting the mean signal measured from 2.5 s before through 2.5 s after picture onset from each volume (Versace et al, 2011). Trials were then averaged across picture categories and participants and plotted above.