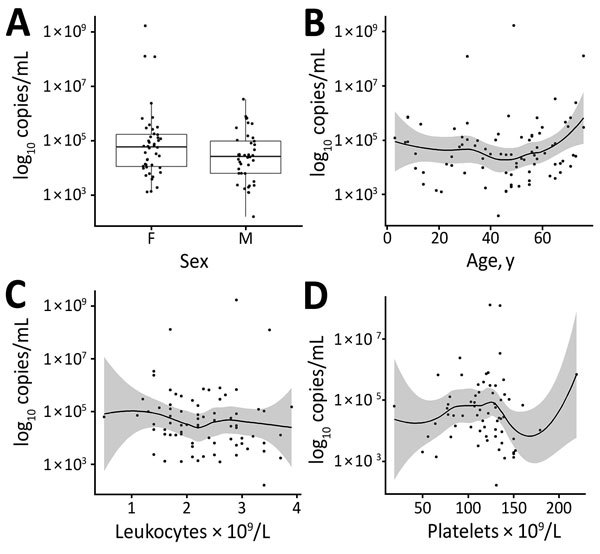
Figure 2.

Distribution of virus RNA load in patients with tick-borne encephalitis, Slovenia, by patient sex (A), age (B), leukocyte count (C), and platelet count determined on the same day as RNA load (D). Boxes in panel A indicate interquartile ranges and 25th and 75th percentiles, horizontal lines within boxes indicate medians, and errors bars indicate 1.5× interquartile ranges. Solid lines in panels B–D indicate loess regression lines, and shaded areas indicate 95% CIs.
