
Figure 3.
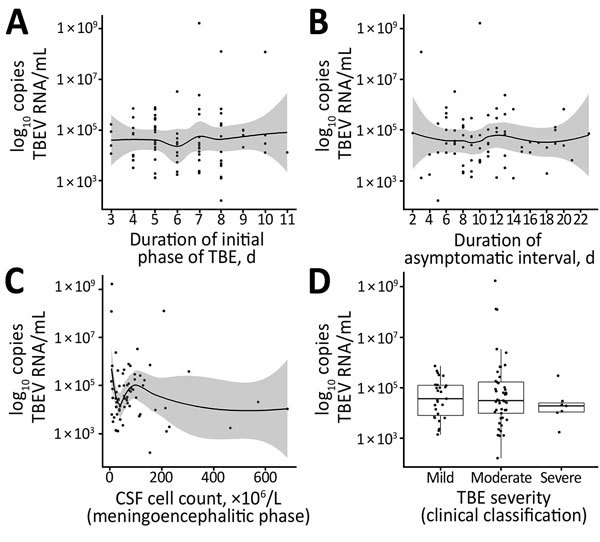
Distribution of virus RNA load in patients with TBE, Slovenia, by duration of initial phase of TBE (A), duration of asymptomatic interval (B), CSF cell count determined in the meningoencephalitic phase (C), and severity of TBE according to clinical classification (D). Solid lines in panels A–C indicate loess regression lines, and shaded areas indicate 95% CIs. Boxes in panel D indicate interquartile ranges and 25th and 75th percentiles, horizontal lines within boxes indicate medians, and error bars indicate 1.5× interquartile ranges. CSF, cerebrospinal fluid; TBE, tick-borne encephalitis; TBEV, TBE virus.