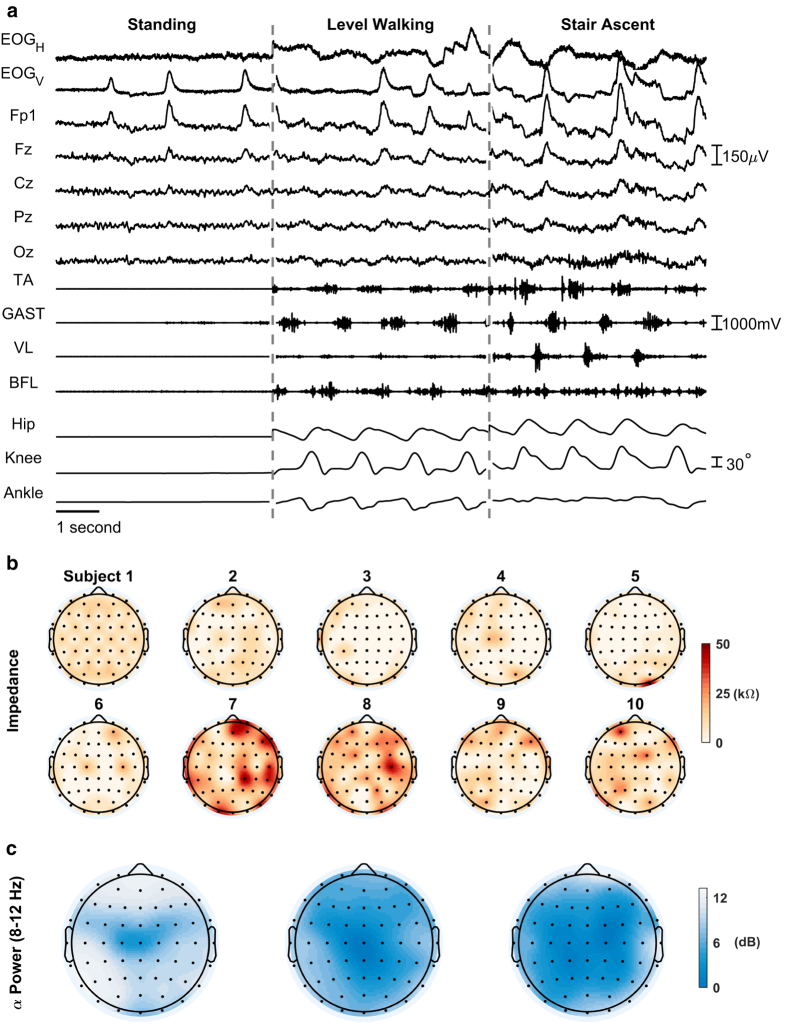
Figure 2. Time-synchronized subset of EOG, EEG, EMG, and kinematic data; channel impedances (kΩ) of the 60-channel EEG; and terrain-specific α power (dB) in all the EEG channels.
(a) The timeseries EOGH (horizontal) and EOGV (vertical) are computed as bipolar signals for the horizontal and vertical EOG channels, respectively. (b) Impedance values (kΩ) of the 60-channel EEG for each of the ten subjects just prior to beginning the experiment. (c) The total α power (dB) in all the EEG channels (60 electrodes) during each of the conditions (standing, LW, SA, from left to right) is shown above the timeseries plot. Gradual increases in α band desynchronization can be observed between as the subject transitions from standing, to level ground walking, to stair walking, respectively.

