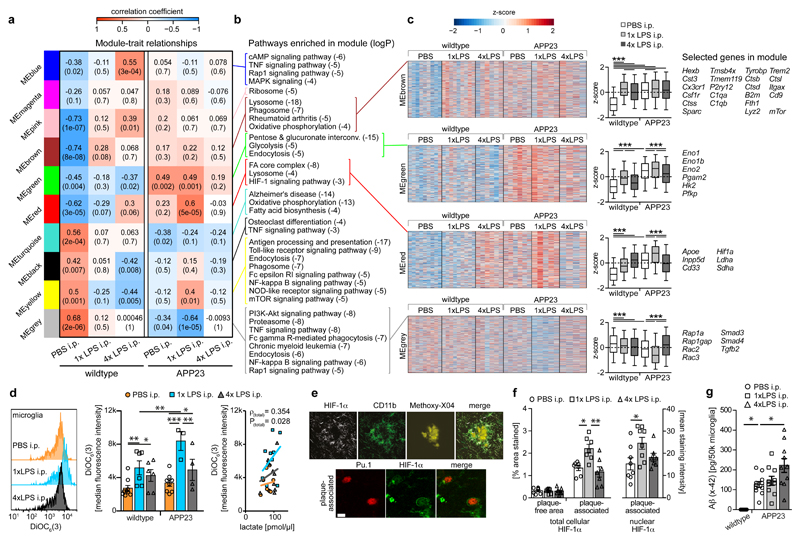
Figure 5. Microglial gene expression and function 6 months after immune stimulation.
a, Weighted gene correlation network analysis (top: correlation coefficient; bottom: P-value; n=9,9,6,6,5,4 animals). b, Selected KEGG pathways enriched in modules. c, Heatmaps of genes within modules, z-scores (boxplot whiskers: 5-95th percentile; n=1601,990,949,3543 genes in modules) and selected genes. d, Microglial mitochondrial membrane potential (left/middle; n=9,6,6,8,3,4 animals) and Pearson’s correlation with lactate release (right; n=11,10,10 animals). e, Staining for top: HIF-1α, microglia (CD11b) and amyloid plaques (Methoxy-X04) and bottom: HIF-1α and microglial nuclei (Pu.1; single confocal plane) in brain sections from 9-month-old animals. Scale bars: 20/5 µm (top/bottom). f, Total cellular (n=7,7,7 animals) and nuclear (n=8,8,7 animals) HIF-1α staining intensity. g, Microglial Aβ content (n=5,11,10,10 animals). */**/*** P<0.05/0.01/0.001 for one-way ANOVA with Tukey correction. Data are means±s.e.m.

