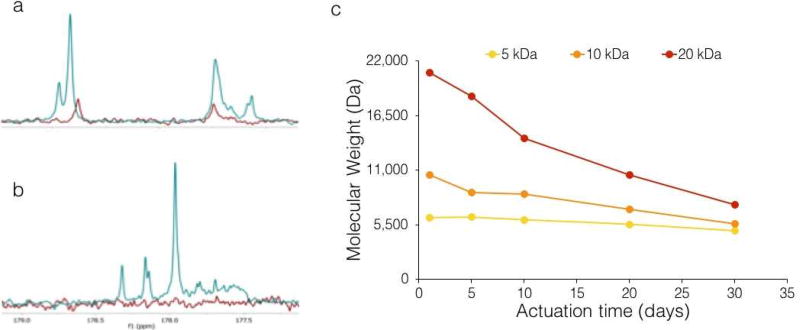
Figure 3. Characterization of actuated polymers using NMR and GPC.
(a–b) NMR spectra of non-actuated 20 kDa polymer (red line) and the same polymer actuated for 30 days (blue line), zoomed on the hydroxyl group region around 58 ppm (a) and the carboxyl group region around 178 ppm (b). (c) Evolution of weight-average MW of aPACE polymers during the actuation process.

