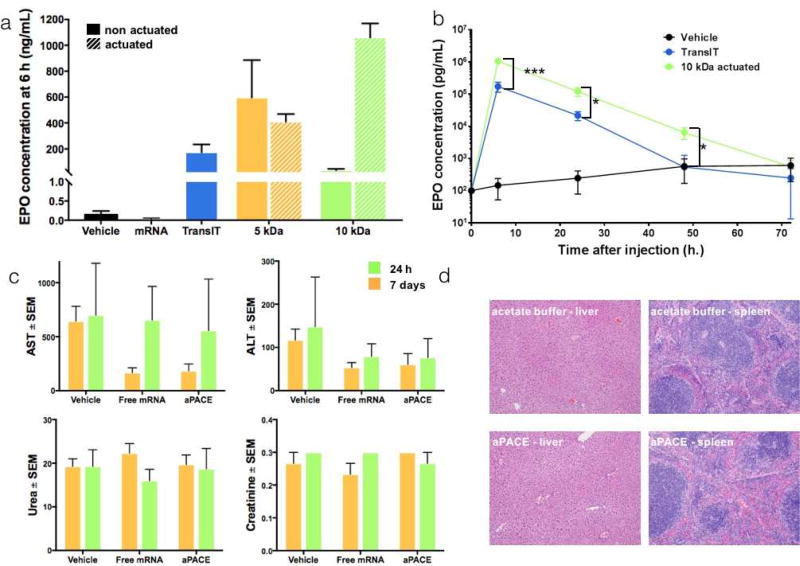
Figure 5. In vivo transfection of EPO mRNA using aPACE.
(a) EPO blood concentration 6 h after IV administration of mRNA (20 µg total) using TransIT, 5 kDa non-actuated PACE, 5 kDa aPACE actuated for 5 days, 10 kDa non-actuated PACE, or 10 kDa aPACE actuated for 10 days. Results are presented as mean ± SD of N = 3 animals (****p < 0.0001). (b) Time course of EPO production following IV administration of mRNA (20 µg total) using TransIT, 5 kDa non-actuated PACE, 5 kDa aPACE actuated for 5 days, 10 kDa non-actuated PACE, or 10 kDa aPACE actuated for 10 days. Results are presented as mean ±SD of N = 3 animals (***p < 0.001 and *p < 0.05). (c) Blood chemistry analysis 24 h and 7 days after IV administration of acetate buffer, free mRNA or mRNA:aPACE polyplexes. Results are presented as mean ± SEM of N = 3 animals. (d) Histology analysis of liver and spleen 24 h after IV administration of acetate buffer or mRNA:aPACE polyplexes. Images are representative of N = 3 animals.

