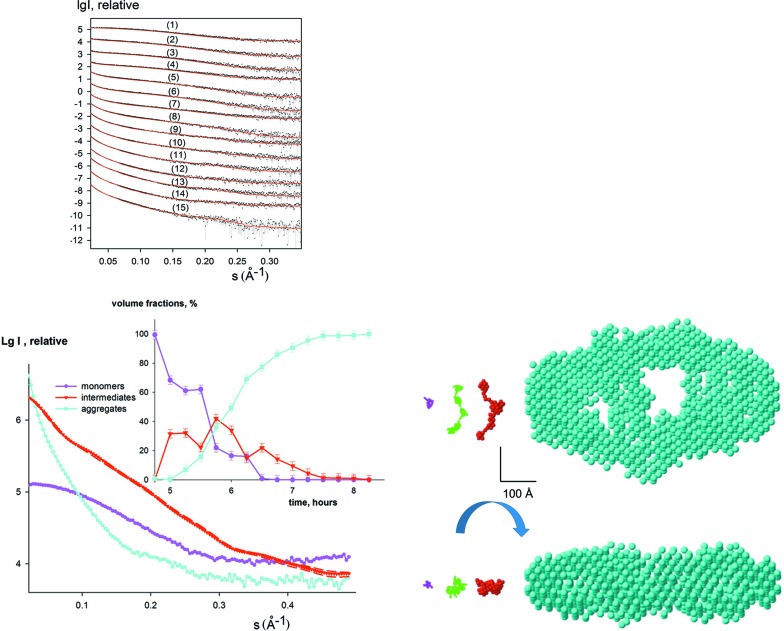
Figure 2.
Analysis of the intermediate during insulin fibrillation. The initial state is well represented by a monomeric model of insulin (PDB entry 1guj) and the final state is approximated by the bead model of the mature fibril (Vestergaard et al., 2007 ▸). The top left panel displays the experimental data (dots with error bars), and the DAMMIX fits as red solid lines. The shapes of the monomer and the aggregates are shown in the bottom right panel with magenta and cyan beads, respectively; the previously reported intermediate pentameric model is displayed with a green Cα trace (Vestergaard et al., 2007 ▸). The restored shape of the unknown intermediate obtained by DAMMIX is displayed in the bottom right panel (red beads). The scale bar is 100 Å. The scattering curves from the components are shown in the bottom left panel (the two most different restored curves for the intermediate obtained from multiple DAMMIX runs are shown with dashed red lines) and their restored volume fractions are displayed as an inset; the colours are the same as the bottom right panel and the error bars of volume fractions display the average dispersion over multiple DAMMIX runs.

