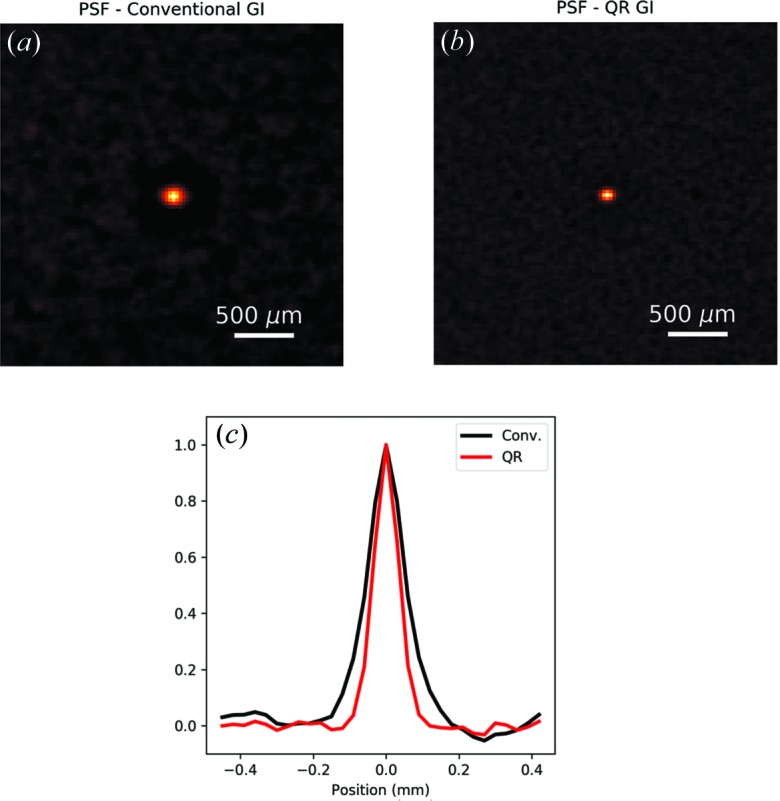
Figure 5.

(a) PSF of the ghost-imaging system, calculated using equation (6), for the conventional ghost-imaging situation. (b) Corresponding PSF calculated after QR decomposition. The PSF appears noticeably narrower, reflecting the resolution improvement afforded by the QR decomposition. (c) Line profile taken across the central horizontal line in the maps in (a) black solid line and (b) red solid line. When fitted with a Gaussian function, the two peaks have a FWHM of 125 µm and 80 µm respectively.
