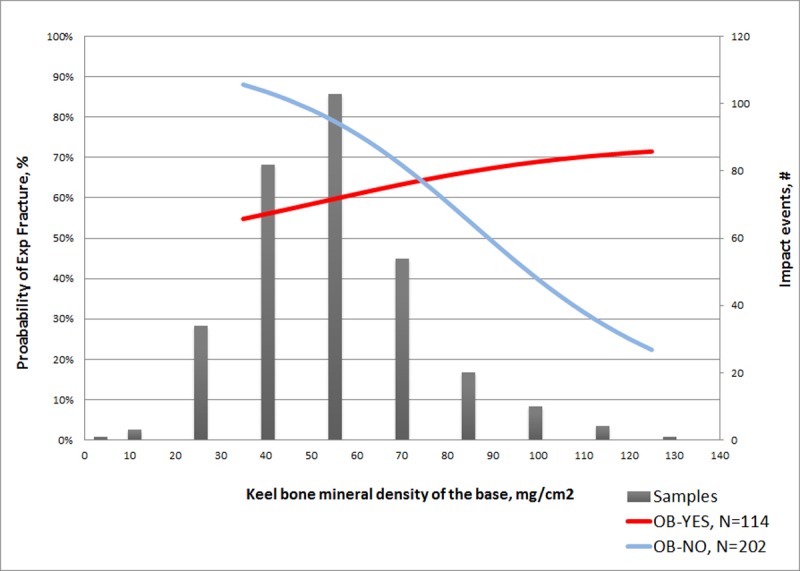
Fig 2. Modeled probability of an experimental fracture (%; Y-axis, left side) in relation to the mineral density of the keel’s base (mg/cm2; X-axis) and the presence of an old break.

Superimposed on the graph is a histogram of the number of keels (#; Y-axis, right side) assessed.
