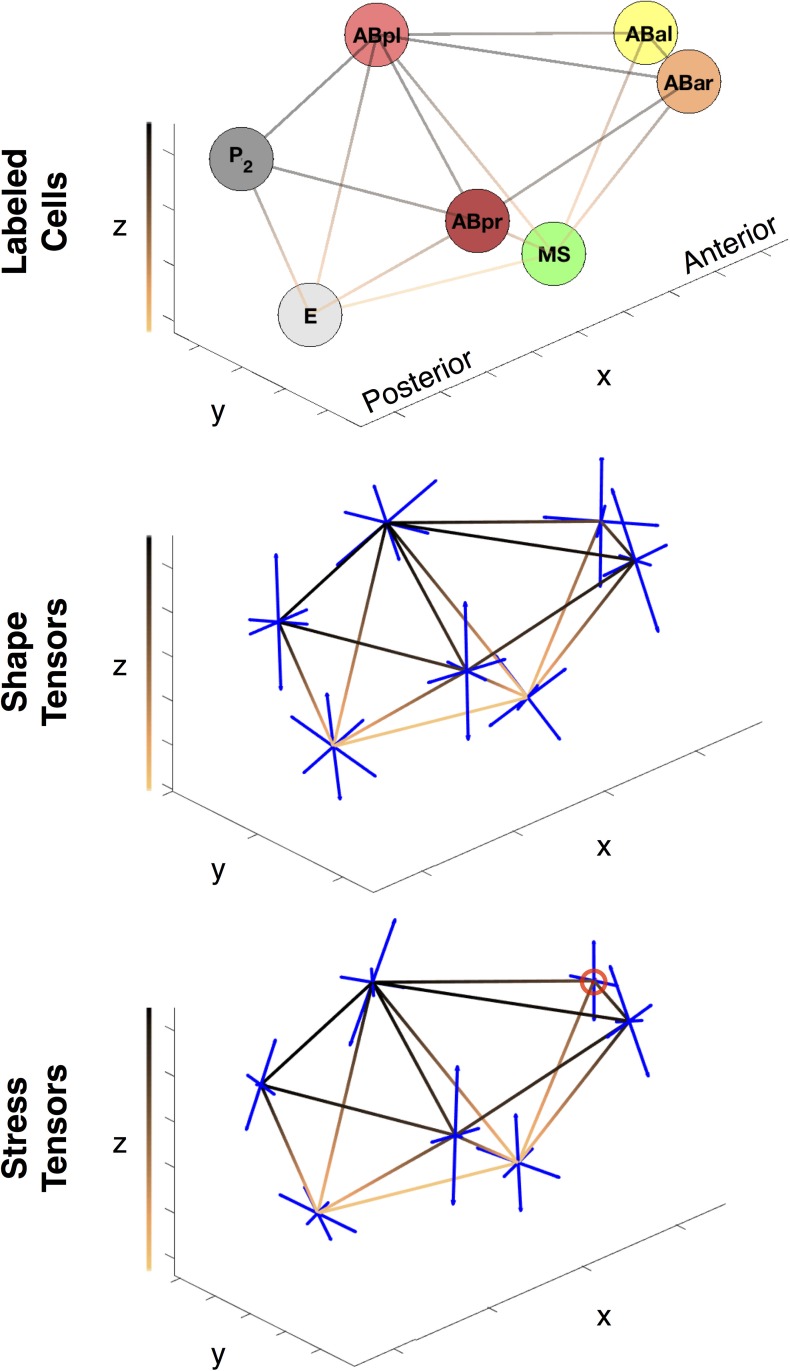
Fig 8. Depiction of the average mechanical state and cell-shape tensors.
Plot of the shape and stress tensors at the 7-cell stage. The copper gradient lines represent cell connectivity, while the colors ranging from black to copper corresponds the depth along the z-axis. The tensors (all of which are symmetric) are represented by their 3 orthogonal eigenvectors plotted as blue line segments. The length of the segments correspond to the magnitude of the eigenvalue. Compressive forces in the stress tensors are plotted as red lines, and are circled in red for clarity.

