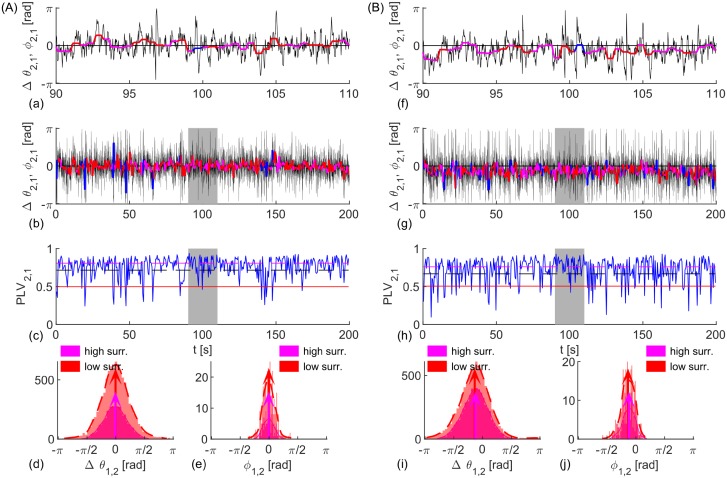
Fig 1. Evolution and statistics of phase metrics for two noisy oscillators with (A) identical and (B) different frequencies.
(a, b, f, g) Phase difference, Δθ1,2, (black), and angle of the cPLV, ϕ1,2, (red and magenta for significant PLV and blue otherwise), with the top plots depicting zoomed phases of the shaded area in the lower plots. (c, h) PLV (blue) and its mean value (black), and two levels of significance (magenta and red). (d, e, i, j) PDF (dashed red and full magenta line), histograms of phase differences Δθ1,2 and angle ϕ1,2 during epochs of synchronization, and their circular mean values (red and magenta arrows). Two different surrogates procedures (high surr and low surr) are used for the levels of significance. Parameters: τ = 0.01s, D = 5, K = 30 (A) ω1,2 = 12 ⋅ 2π rad/s; (B) ω1,2 = 12 ⋅ [0.95, 1.05] ⋅ 2π rad/s.

