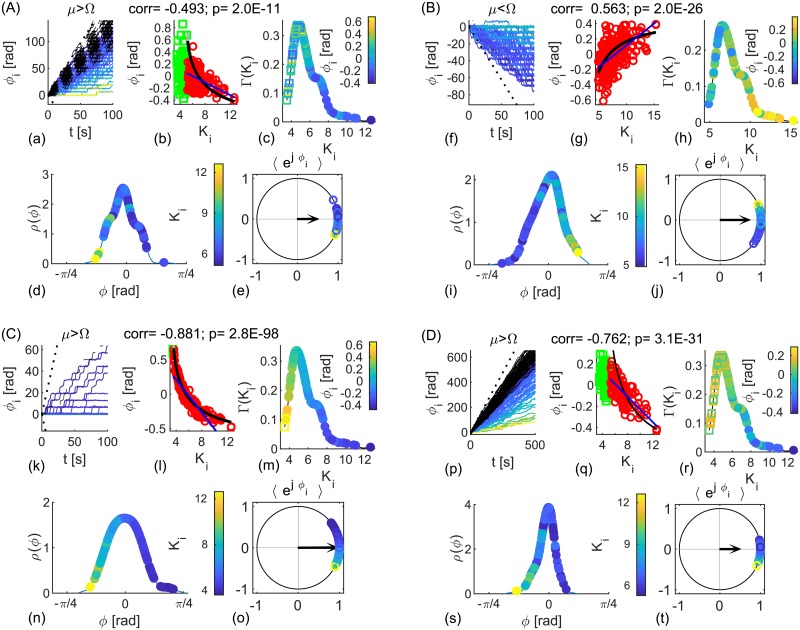
Fig 6. Identical noisy phase oscillators coupled with homogeneous bimodal-δ delays and log-normal coupling strengths.
Synchronization at frequency (A, C, D) Ω > μ and (B) Ω < μ. (a, f, k, p) Phases ϕi(t) of the synchronized (colored coded with the in-strength) and unsynchronized (dashed black) oscillators, and the mean phase, ±(Ω − μ)t (dashed lines). (b, g, l, q) Scatter plot of averaged relative phases and nodes in-strengths, showing synchronized (red) and unsynchronized (green) oscillators. Black line is the theoretical prediction Eq (21) and blue is the linear fit of the correlation. (c, h, m, r) Node strengths color-coded with their phases (filled circles are synchronized, and empty squares are unsynchronized), and their PDF. (d, i, n, s) Phases of synchronized oscillators color-coded with their in-strength, and their PDF, ρ(ϕ) and (e, j, o t) geometric representation and the complex order parameter (black arrow). Parameters: N = 300, simulation time (A-C) tfin = 200s and (D) tfin = 2000s. (A, B, D) D = 1, (C) D = 0.1. Log-normally distributed in-strengths with σK = 2μK, (A, C, D) μK = 6 and (B) μK = 8. Delays (A, C, D) τ = [0.02, 0.37]s, (B) τ = [0.07, 0.63]s.

