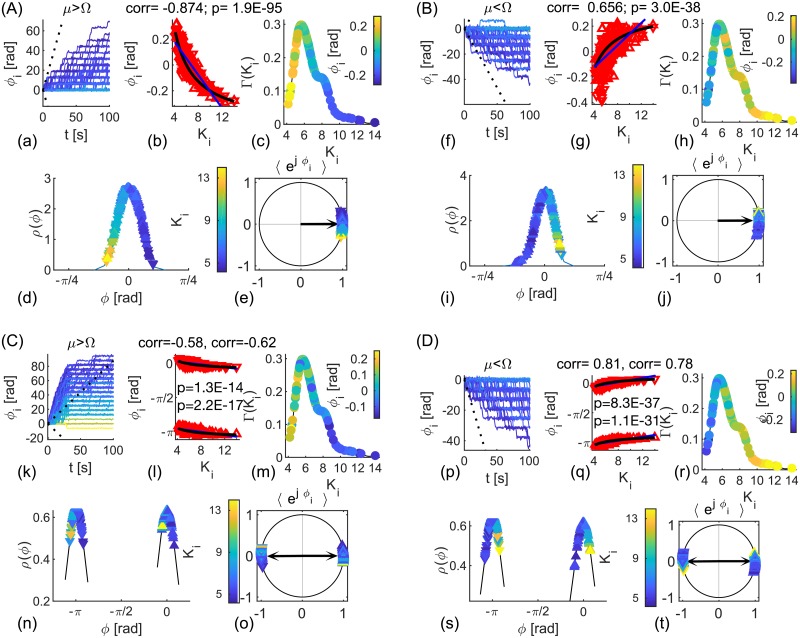
Fig 8. Delay-imposed clusters of identical noisy phase oscillators.
(A, B) In- and (C, D) anti- phase synchronization, with log-normally distributed coupling strengths Kij. (a, f, k, p) Phases ϕi(t) of synchronized oscillators (color-coded with their in-strength) and the mean phase, ±(Ω − μ)t (dashed). (b, g, l, k) Scatter plot of averaged relative phases and nodes strength. Oscillators of the different populations are with opposite pointing triangles. Black line is the theoretical prediction, Eq (33), blue is the linear fit for each population. (c, h, m, r) Node strengths color-coded with their relative phases and their PDF. (d, i, n, s) Phases of the synchronized oscillators (color-coded with their in-strength) and their PDF, and (e, j, o, t) their geometric representation and complex order parameter (black arrow). Parameters: N = 300, K = 7, D = 1. (A) τ = [0.05, 0.2]s, (B) τ = [0.7, 0.95]s, (C) τ = [0.22, 0.47]s, and (D) τ = [0.04, 0.27]s.

