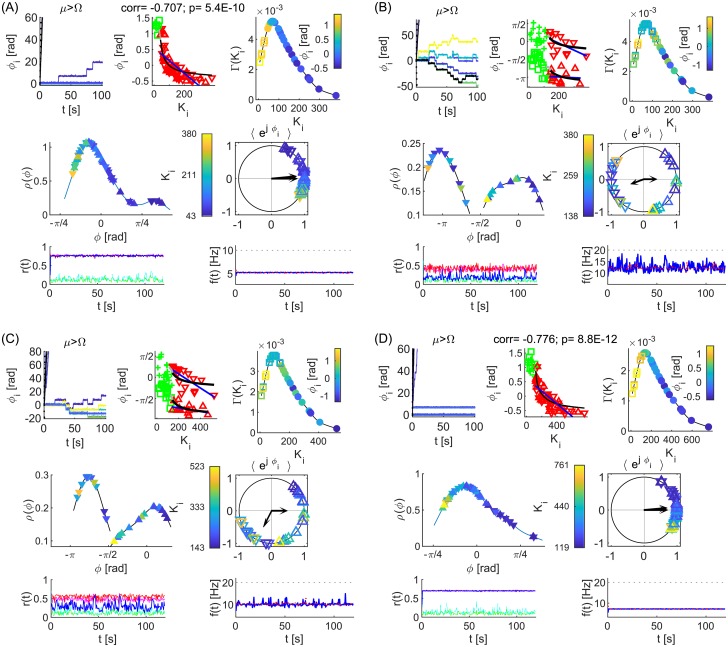
Fig 10. Simulated dynamics over a healthy human connectome.
In-phase (A, D) anti-phase (B) and intermittent synchronization (C). Top left plot of each panel are relative phases for the synchronized and two unsynchronized oscillators (black) closest to the limits, and ±(Ω − μ)t (dashed). Top middle are scatter plots of nodes averaged phases versus their in-strengths. Nodes of left/right hemisphere are up/down pointing triangles, black line is a theoretical prediction, blue is the linear fit. Top right are the PDF of in-strengths color-coded with nodes’s phases. Middle left are phases of the synchronized oscillators (color-coded with in-strength) and their PDF; and middle right is their geometric representation and complex order parameters (black arrows). Bottom left and right are evolutions of order parameter and mean field frequencies, for whole brain (blue) and for each hemisphere (red and magenta). Order parameters for uncoupled case are green for whole brain and cyan for one hemisphere. Parameters: N = 68 oscillators, noise intensity D = 2. Coupling strengths (A, B) K = 0.8, (C) K = 1.1, (D) K = 1.6, natural frequency (A) f = 10Hz and (B–D) f = 20Hz.

