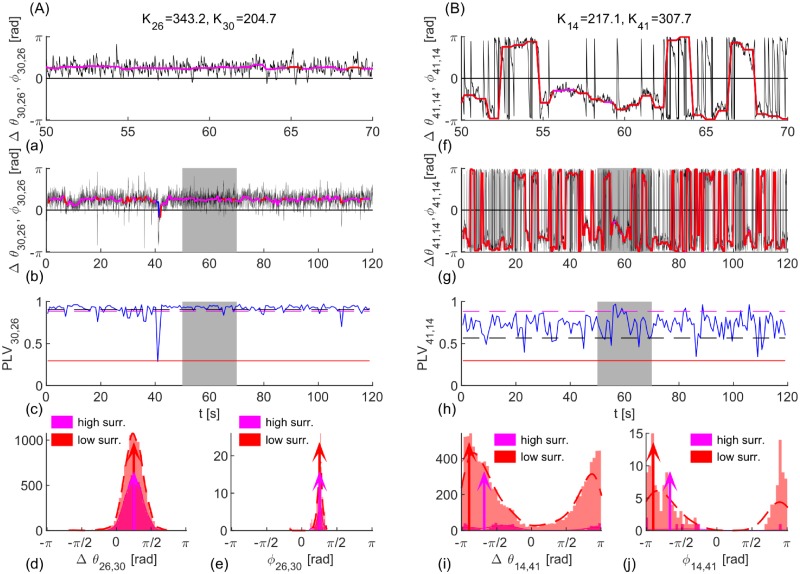
Fig 11. Evolution and statistics of PLV and phase lags for one (A) intra and (B) inter-hemispheric link.
(a, b, f, g) Phase lag, Δθ, (black), and angle of the cPLV, ϕ, (red and magenta for significant PLV, blue otherwise). (c, h) PLV (blue) and its mean value (black), and two levels of significance (magenta and red). (d, e, i, j) Estimated PDF (magenta line and dashed red) and histograms of phase lags, and their means (red and magenta arrows). Parameters: f = 20Hz, D = 2, (A) K = 1.1, (B) K = 1.16.

