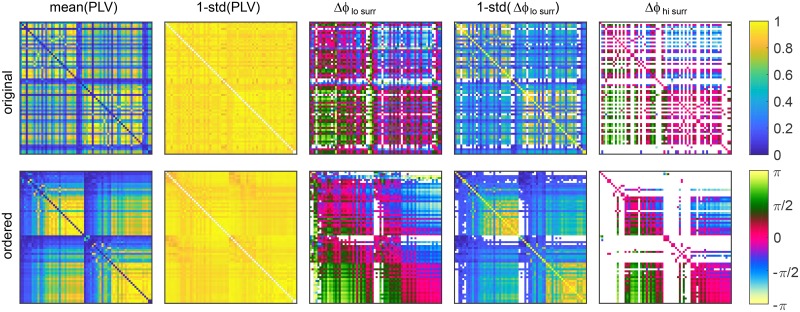
Fig 12. Statistics of PLV and phases for 68 brain regions.
Nodes are as given by Desikan Kiliany parcelation (top) and ordered within hemispheres by the in-strength (bottom). For each link the mean and 1–standard deviation are shown, while white are links with no periods of significant coherence. Parameters: K = 1.18, f = 20Hz, D = 2.

