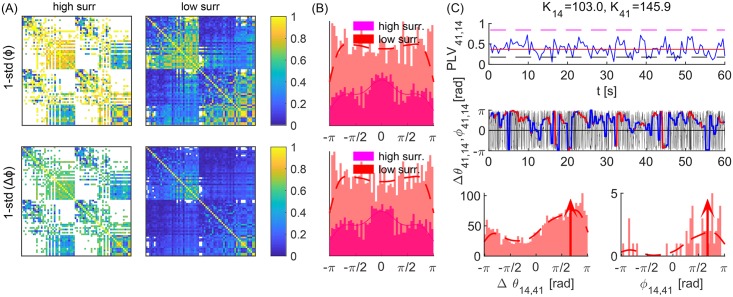
Fig 13. Statistics of PLV metrics for two significance levels.
(A) Standard deviation of phase lags. (B) Histogram of mean phase lags for all the links, calculated over periods of significance. (C) Evolutions of PLV (top) and phase lags (middle), and their histograms (bottom) for both levels of significance (magenta and red in all plots) for one inter-hemispheric link. Parameters: K = 0.55, f = 20Hz, D = 4.

