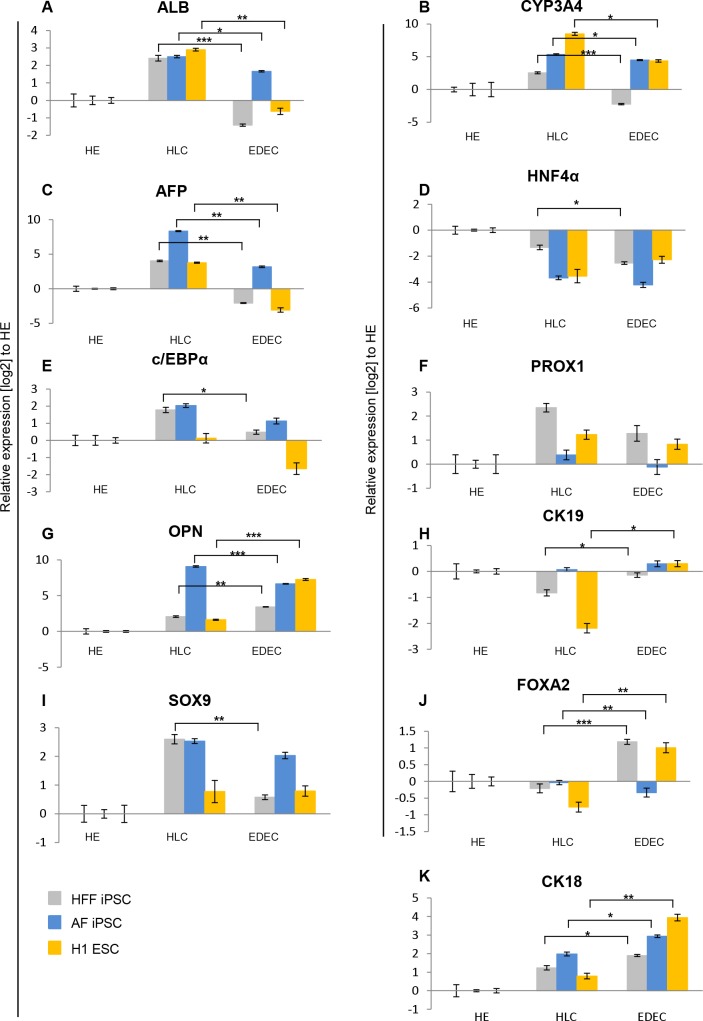
Fig 5. Temporal expression of markers during differentiation.
Two iPSC lines and one ESC line were differentiated into either HLCs or EDECs and qRT-PCRs for expression of characteristic hepatocyte and cholangiocyte markers was performed. Gene expression was normalized to RPS16 and fold change was calculated relative to HE cells. Mean values of technical triplicates of biological duplicates are show. Error bars represent SEM. P-Values were calculated with two-tailed student’s t-tests (*** = p-value < 0.001, ** = p-value < 0.01, * = p-value < 0.05).

