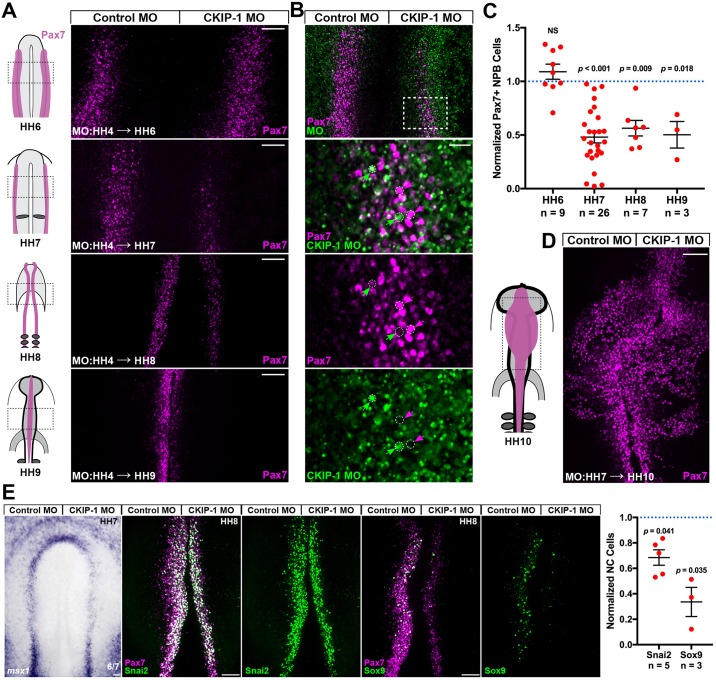
Fig 3. CKIP-1 is required prior to HH7 to maintain NC fate.
(A) Bilateral electroporations were performed with control MO (left) and CKIP-1 MO (right) at HH4, and embryos were incubated to the indicated stages. Whole-mount dorsal views are shown following Pax7 and FITC immunostaining. (B) Single-cell examination of an HH7 embryo following electroporation described in A. Cells that received high levels of CKIP-1 MO show little Pax7 expression (green arrows), while strongly Pax7+ cells in the NPB show very little CKIP-1 MO uptake (magenta arrows). (C) Gastrulating embryos were electroporated as described in A, and normalized Pax7 cell counts are displayed with means ± SEMs at the indicated stages. P values from two-tailed Student t test. (D) Bilateral electroporations of control MO and CKIP-1 MO at HH7 results in normal Pax7 expression at HH10. (E) Bilateral electroporations of control MO and CKIP-1 MO were performed at HH4; embryos were processed for in situ hybridization for NPB marker msx1 at HH7 or for immunostaining for NC specification markers Snai2 and Sox9 at HH8. Displayed are cell counts normalized to the control side with mean ± SEM. Underlying data can be found in S1 Data. P values from two-tailed Student t test. Scale bars represent 100 μm (A,D,E) or 25 μm (B). CKIP-1, casein kinase interacting protein 1; FITC, fluorescein isothiocyanate; HH, Hamburger-Hamilton stage; MO, morpholino oligonucleotide; Msx1, msh homeobox 1; NC, neural crest; NPB, neural plate border; NS, not significant; Pax7, paired box 7; Sox9, Sry-related HMg-Box gene 9.

