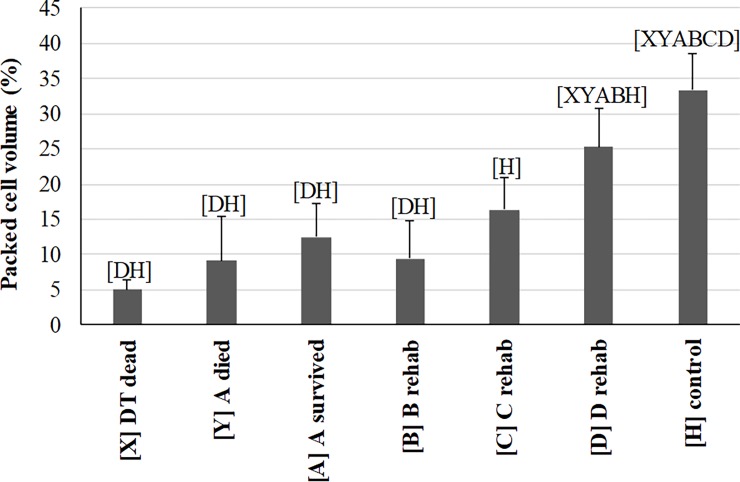
Fig 3. Comparison of packed cell volume (PCV) measured in debilitated loggerhead sea turtles (DTs) before and during rehabilitation and compared to healthy loggerhead turtles (means and one standard deviation).
Lines represent an individual turtle through rehabilitation. Each turtle group on the x-axis was significantly different (p<0.05 or p<0.00883 for repeated measures) from groups represented by letters above data. Sample size for each group: 2 [X], 10 [Y], 11 [A], 7 [B], 6 [C], 9 [D], 69 [H].

