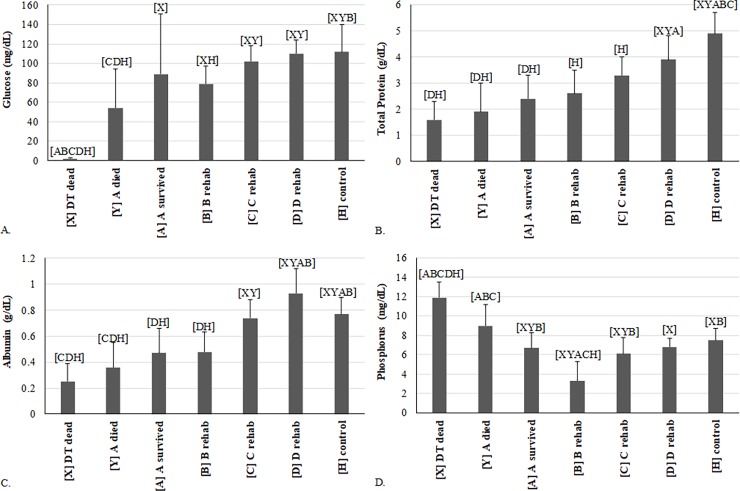
Fig 4. Comparison of variables measured in debilitated loggerhead sea turtles (DTs) before and during rehabilitation and compared to healthy loggerhead turtles (means and one standard deviation).
Each turtle group on the x-axis was significantly different (p<0.05 or p<0.00883 for repeated measures) from groups represented by letters above data. (A) glucose; (B) total protein by biuret method at U. Miami; (C) albumin by plasma electrophoresis; (D) phosphorus. Lines represent an individual turtle through rehabilitation. For samples sizes in each diagram, please refer to S3 Table.

