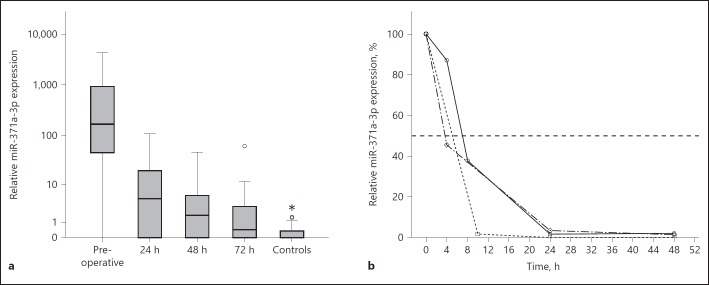
Fig. 1.
a Box plot showing the different relative microRNA (miR)-371a-3p expressions in serum samples of patients with testicular germ cell tumours (GCTs) at consecutive time points following orchiectomy. See the Methods section for clinical details. Horizontal line within box denotes median serum relative quantity (RQ) value, upper and lower limits of boxes denote inter quartile ranges (IQRs). Whiskers show lowest and highest values within a range of 1.5 IQR. The y-axis represents a logarithmic scale. b Line graph showing the rapid decay of serum miR-371a-3p levels in 3 patients with multiple tests during the first 24 h after surgery. See the Methods section for clinical details. The y-axis represents percentages of the preoperative serum values. The horizontal dashed line depicts the 50% reduction level.

