
Fig. 2.
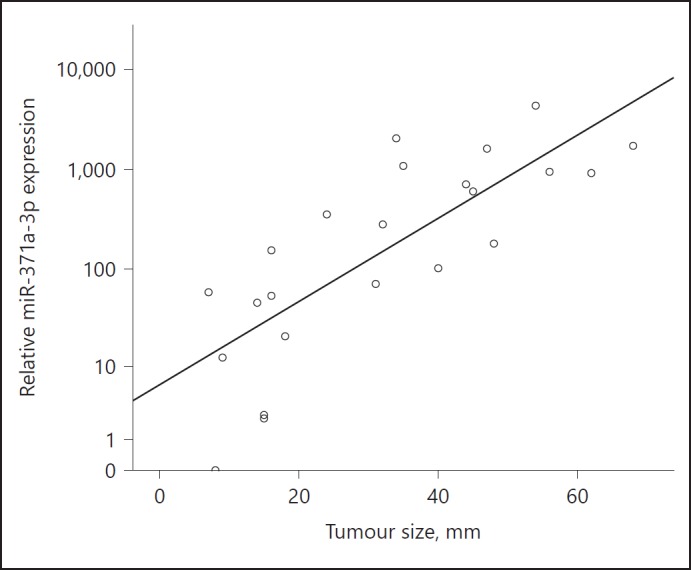
Scatter plot showing the correlation between the preoperative relative expression of miR-371a-3p and the tumour size in 24 patients with testicular germ cell tumour (GCT). The y-axis is displayed in a logarithmic scale.
Official websites use .gov
A
.gov website belongs to an official
government organization in the United States.
Secure .gov websites use HTTPS
A lock (
) or https:// means you've safely
connected to the .gov website. Share sensitive
information only on official, secure websites.
Scatter plot showing the correlation between the preoperative relative expression of miR-371a-3p and the tumour size in 24 patients with testicular germ cell tumour (GCT). The y-axis is displayed in a logarithmic scale.