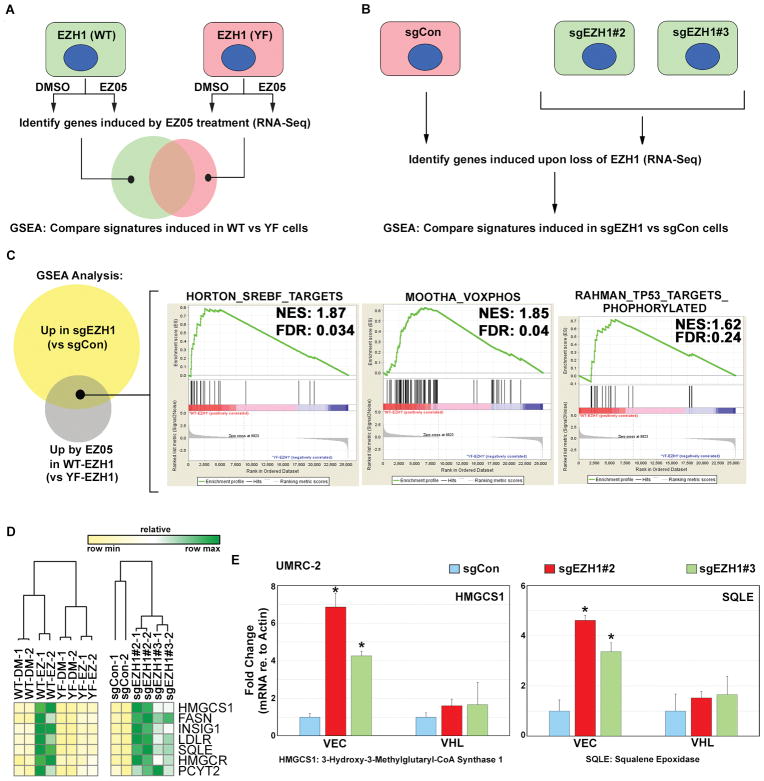
Fig. 8. Transcriptional response to EZH1 loss is influenced by pVHL status.
(A and B) Schema for RNA-Seq analysis to measure the transcriptional response to EZH1 inactivation, either using pharmacological inhibition (A) or genetic loss (B). In (A), 786-O cells stably expressing wild type EZH1 (WT) or the Y727F (F) mutant were treated with 4 μM JQ-EZ-05 or DMSO for 3 days. In (B), RNA was prepared from UMRC-2 cells expressing the indicated sgRNA for 7 days.
(C) Venn diagram showing GSEA gene sets upregulated by either pharmacological or genetic inactivation of EZH1. Right panel shows representative gene sets that were induced under both conditions.
(D) Heatmap depicting mRNA expression, as measured by RNA-Seq, of the indicated genes under conditions described in (A) and (B).
(E) Abundance of the indicated mRNAs (relative to actin mRNA), as determined by real-time qPCR, in UMRC-2 cells expressing either pVHL (VHL) or empty vector control (VEC) that were superinfected to express the indicated sgRNAs. Values are expressed relative to sgCon cells. RNA was prepared from cells expressing the indicated sgRNA for 7 days, before the onset of overt toxicity linked to EZH1 loss. p-values were calculated using the Students t-test and p<0.05 was considered significant [*].

