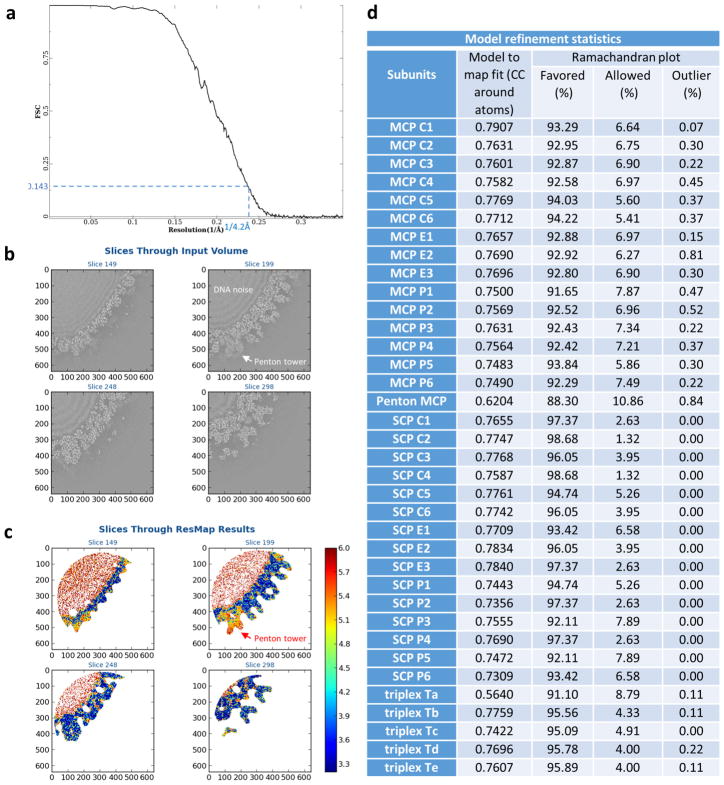
Extended Data Figure 2. Resolution assessment of the cryo-EM reconstruction and model refinement statistics.
a, Gold-standard FSC curve of the cryo-EM reconstruction. The average resolution of the final density map is 4.2 Å as determined by the FSC = 0.143 criterion44. b, c, Local resolution assessment by ResMap52. A 6403-voxel sub-volume of the final density map was subjected to ResMap processing. Four slices of the input volume (b) and the local resolution heat map (c) are shown. Note that many regions of the density map have better resolution than the FSC-measured average resolution of 4.2 Å. The penton tower region has the lowest resolution because of its flexibility. d, Model refinement statistics reported by the Phenix real space refinement program47.

